Newly released
Clearing Encampments or Resolving Homelessness?
What Los Angeles's two main responses to encampments, sweeps and Encampment Resolution Programs, actually do and for whom. A PATHS report, October 2026.
Los Angeles has invested heavily in supportive and interim housing, rental assistance, and homelessness services, yet the supply still falls well short of demand. As the 2028 Olympic and Paralympic Games approach, officials face growing pressure to address unsheltered homelessness, particularly in highly visible areas.
The county relies on two principal approaches. Conventional encampment clearances, commonly called sweeps, direct people to move and may involve sanitation workers, law enforcement, citations, arrests, and the removal of personal belongings. Encampment Resolution Programs, or ERPs, are intended to offer a more service oriented alternative. Programs such as the City of Los Angeles's Inside Safe initiative and Los Angeles County's Pathway Home use targeted outreach and offers of interim housing, typically in hotels or motels, with the stated goal of helping participants reach permanent housing.
This report examines how these approaches operate in practice, whom they reach, and what happens to the people affected by them. The quantitative analysis draws on roughly 17,000 monthly surveys completed by 1,600 participants in the PATHS study between April 2023 and July 2026. Because PATHS follows the same people over time, including after they enter shelter or housing, it allows us to examine not only whether someone experienced a sweep or was invited to participate in an ERP, but what happened afterward.
Alongside these quantitative findings are first person accounts developed through WeSearch, a poor people led research practice grounded in the principle that people who have experienced homelessness possess expertise essential to understanding and addressing it.
The headline numbers
- swept in any given month
- 1 in 4swept in any given monthAlmost two thirds were swept at least once in their first year.
- of sweeps came with a shelter or housing offer
- 11%of sweeps came with a shelter or housing offerJust 4% of all sweeps resulted in a meaningful shelter stay.
- accepted the offer when one was made
- 2 in 3accepted the offer when one was made78% for motel or hotel placements, 80% for bridge or transitional housing.
- ERP shelter retention, per person reached
- 12xERP shelter retention, per person reachedYet fewer than 1 in 25 respondents were enduringly placed.
PATHS monthly surveys, April 2023 to July 2026.
What we found
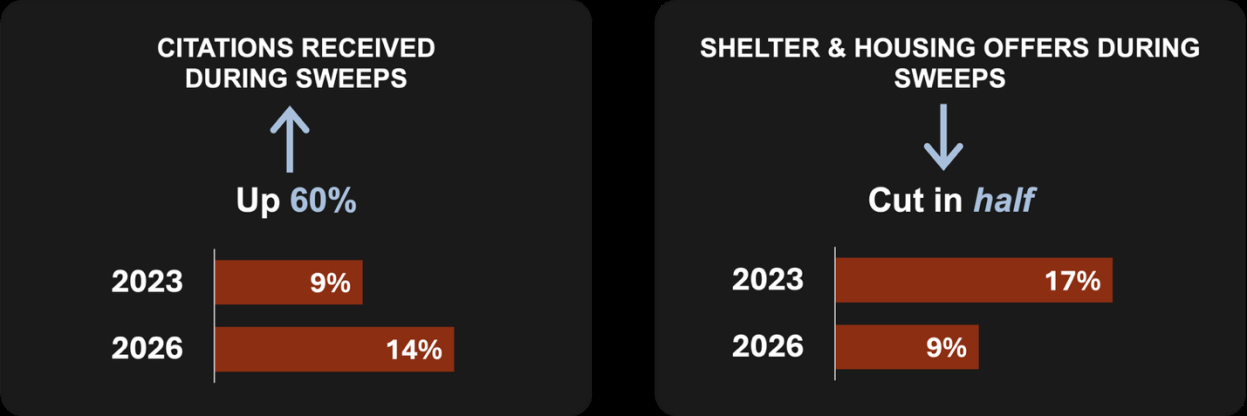
Sweeps are a routine experience for unsheltered Angelenos, but they rarely provide a pathway indoors and are becoming more punitive. On average, one in four PATHS respondents reported experiencing a sweep in any given month. Between 2023 and 2026 the share of sweeps involving a shelter or housing offer fell by nearly half, while the share resulting in a citation rose by almost 60%.
The constraint is the short supply of meaningful offers, not an unwillingness to accept help. Two thirds of respondents who received a shelter or housing offer during a sweep accepted it, reaching 78% for motel or hotel placements and 80% for bridge or transitional housing. Even congregate shelter, which very few identified as a preferred option, was accepted by nearly half of those offered it. These findings challenge the common assumption that people choose to stay outside.
The consequences of sweeps extend well beyond being told to move. Sweep exposure was associated with increases in forced displacement, police contact, property loss, food insecurity, emergency department use, harassment, physical or sexual violence, poorer self rated physical health, and greater psychological distress.
ERPs perform substantially better than conventional sweeps in shelter yield and retention as well as service access, but their reach is limited. From December 2023 through July 2026, 22% of the cohort reported an ERP invitation, while 60% experienced a sweep over the same period. On a per person reached basis, ERPs produced roughly twelve times the shelter retention rate of sweeps, and were associated with a 10 percentage point increase in receiving help applying for services.
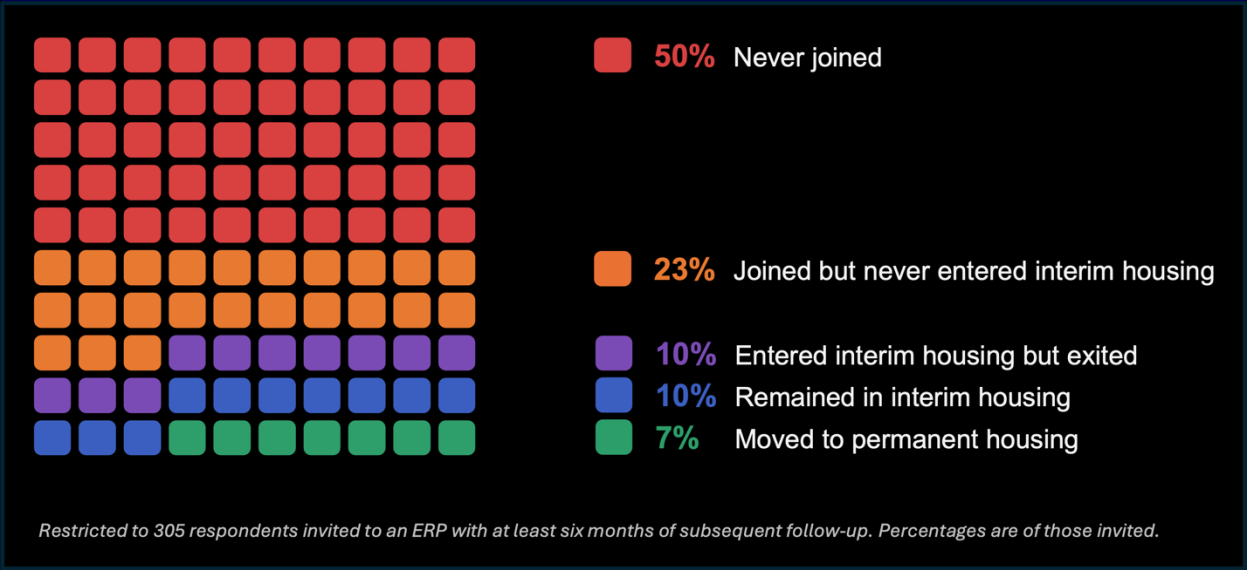
Better than a sweep, however, is not the same as resolving homelessness. Among people invited to an ERP and followed for six months, half never joined, and a further 23% joined but never entered interim housing. Of the roughly one quarter who did get indoors, 10% had already exited by six months. That leaves 10% still in interim housing and 7% in permanent housing, about one in six of those invited, and fewer than 2% of the full PATHS cohort.
How this was studied
This report weaves together two complementary sources of evidence. The first is quantitative data from the PATHS longitudinal survey. The second is narratives written by currently or recently houseless people, or poverty scholars, who have been exposed to repeated sweeps and ERP programs such as Inside Safe.
These houseless Herstories and Histories were produced through a Street Writing Workshop conducted by Aetna Street Solidarity and POOR Magazine in the San Fernando Valley, using a community led process called WeSearch that reassigns authorship and control to the people whose lives are being described. Major findings were then reviewed with the HPRI Lived Expert Advisory Board. Future PATHS reports will build on this partnership by involving WeSearchers in questionnaire design, analysis, and interpretation.
Table 1. Academic research and WeSearch: Not either/or but both/and
| Academic researchers / scholars | Poor people / poverty scholars |
|---|---|
| Expertise | Academic training |
| Incentives | Publications, prestige, impact |
| Methodologies | Mixed, but favoring quantitative |
| Resources | Federal and foundation grants, institutional privilege |
PATHS features a representative sample of people experiencing unsheltered homelessness at study baseline, with ongoing monthly survey tracking on housing, health, and well being, even if respondents move into housing or shelter. Since the study launched in December 2021, a total of 20,800 monthly surveys has been collected among 1,910 respondents through July 2026.
After publication of the November 2023 report, the PATHS team worked with city and county officials, including staff of Pathway Home and Inside Safe, to develop a set of questions that could capture experiences of ERPs. These were introduced into the survey in December 2023 following Institutional Review Board approval. Critically, this allows us to observe a single cohort of people as they experience both sweeps and ERPs. For ERPs we are not limited merely to those who enter the program; we also track the fairly large number of people who never make it into a hotel or motel.
Each key measure is recorded over a 30 day recall window, corresponding to the interval between monthly surveys. Because sweeps and ERP invitations are asked about separately, respondents can report both in the same month, and sweep related shelter and housing offers are distinct from ERP participation.
Table 2. Summary of key measures
| Measure | Definition |
|---|---|
| Sweep | Told in the past 30 days you had or were going to have to move from the area you were sleeping in because of a “sweep” or enforcement of a no-camping or sitting, sleeping, or lying law by the following: police or other law enforcement; sanitation workers; homeless outreach workers; or other public enforcement personnel (e.g., Parks and Recreation, Department of Transportation, Caltrans). Follow-up |
| Police contact | Had any contact with police or law enforcement in the last 30 days (e.g., were approached by an officer, spoke with them, or had further interaction). |
| Received a citation | Ticketed or cited at least once in the past 30 days for staying on the street. |
| Encampment Resolution | Whether the respondent was approached about enrolling in the LA Mayor’s program (Inside Safe), the LA County program (Pathway Home), or an unidentified program in the past 30 days. Program names were not used in the survey item itself, as government partners indicated these names were not necessarily in wide use among outreach teams. |
The study sample consists of 1,667 individuals who contributed 17,149 monthly surveys in total from April 2023 through July 2026. Respondents completed an average of 21 monthly surveys each.
Compared to LA County's broader unsheltered population, as characterized by respondents of the Homeless Count Demographic Survey conducted from 2022 to 2026, the PATHS analytic sample skews younger, with a higher share aged 30 to 44 (46% vs. 39%) and fewer in the 60 and above group (8% vs. 16%). The sample is somewhat more concentrated in the South Bay region and less concentrated in Metro LA. Race, ethnicity and rates of chronic homelessness are broadly similar across the two groups.
Table 3. Sociodemographic characteristics of the PATHS study sample (N=1,667)
| Characteristic | % |
|---|---|
| Age 18–29 | 17% |
| Age 30–44 | 46% |
| Age 45–59 | 28% |
| Age 60 and above | 8% |
| Male | 54% |
| Female | 44% |
| Other | 1% |
| Hispanic or Latino/a/x (alone or in combination) | 40% |
| White | 26% |
| Black | 23% |
| Asian | 2% |
| American Indian or Alaska Native | 1% |
| Native Hawaiian or Pacific Islander | 1% |
| Multiracial | 4% |
| Chronically homeless (homeless > 1 year) | 81% |
| Previously incarcerated | 56% |
| Prior diagnosis of a physical health condition | 46% |
| Prior diagnosis of a substance use disorder | 33% |
| Antelope Valley | 4% |
| San Fernando Valley | 17% |
| San Gabriel Valley | 7% |
| Metro | 24% |
| West | 13% |
| South | 15% |
| East | 7% |
| South Bay | 14% |
Values reported reflect participants’ status at enrollment. “Prefer not to answer” responses are not shown but factored into the column percentages. Service Planning Areas are eight geographic subdivisions of LA County used for service planning, resource allocation, and reporting; percentages were calculated excluding respondents who declined to report their location.
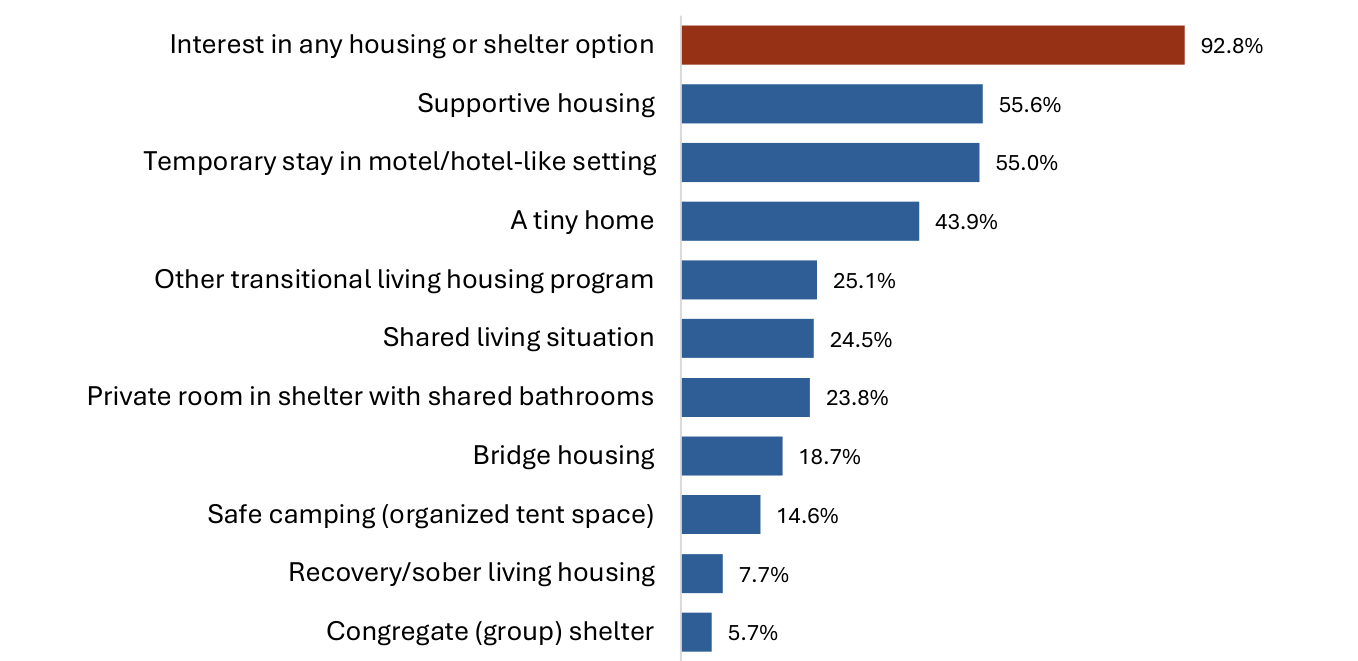
Low rates of shelter and housing placement from sweeps and ERP programs are sometimes attributed to the misperception that unhoused people do not want what is offered. As a baseline, respondents were asked at enrollment which housing and shelter options they would be interested in receiving. They were open to a wide range: 93% expressed interest in at least one, and on average selected between two and three.
Part 1: Sweeps and policing
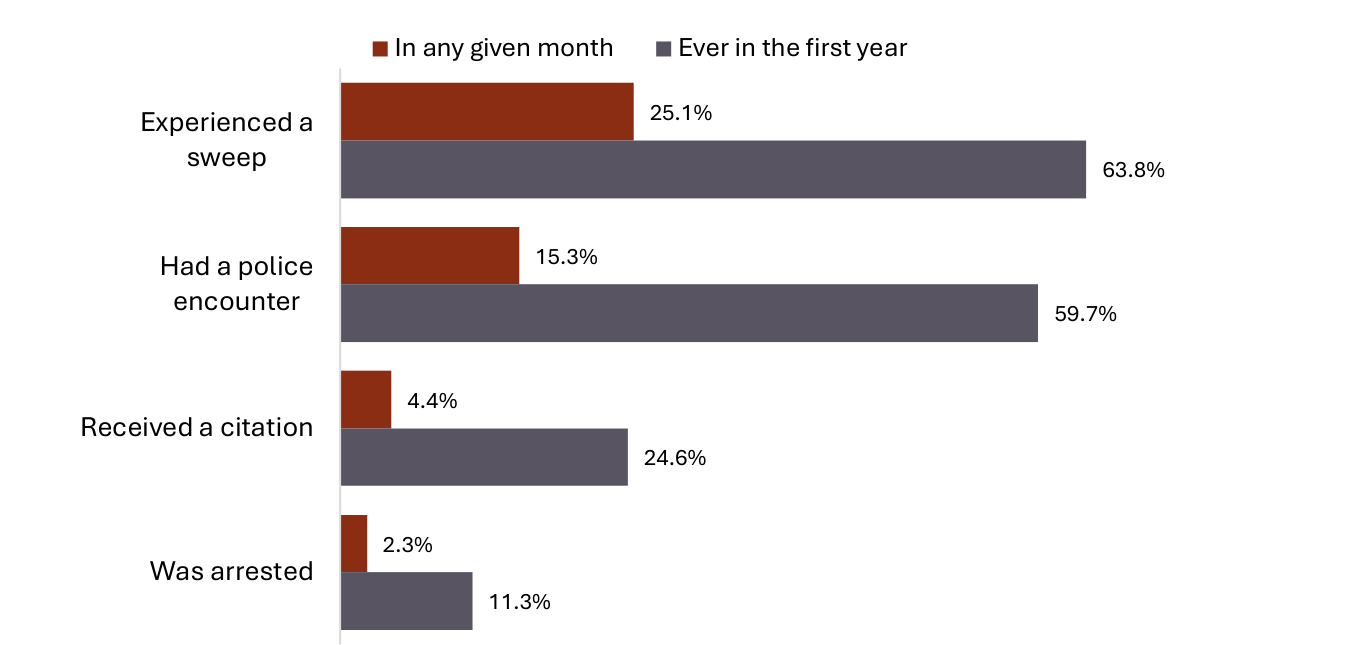
PATHS can answer this at a monthly level and cumulatively across all months of follow up. From April 2023 through July 2026, an average of one in four respondents reported experiencing a sweep in any given month. These experiences add up across multiple months: almost two thirds of returning respondents experienced a sweep in their first year in the study, and over half experienced at least two sweeps.
Rates of police contact are similarly high, driven both by sweeps and by day to day exposure to law enforcement. Six in ten respondents reported police contact in their first year. A quarter received a citation in that first year and more than one in ten were arrested. By comparison, the annual arrest rate of US adults is about 5 in 1,000, making PATHS respondents more than 20 times more likely to report an arrest. These estimates reflect only the average nine months per year in which respondents completed a survey, and arrests may lead to loss of contact with the study surveys, so these figures likely underestimate the true level of police contact.
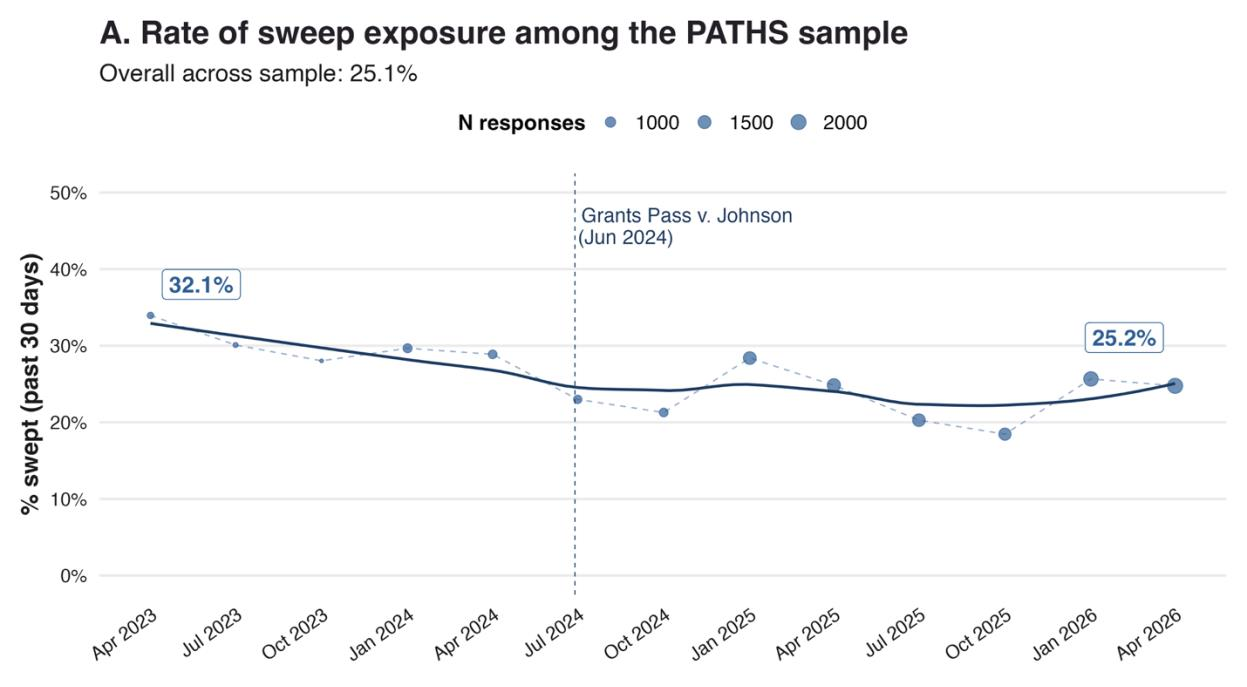
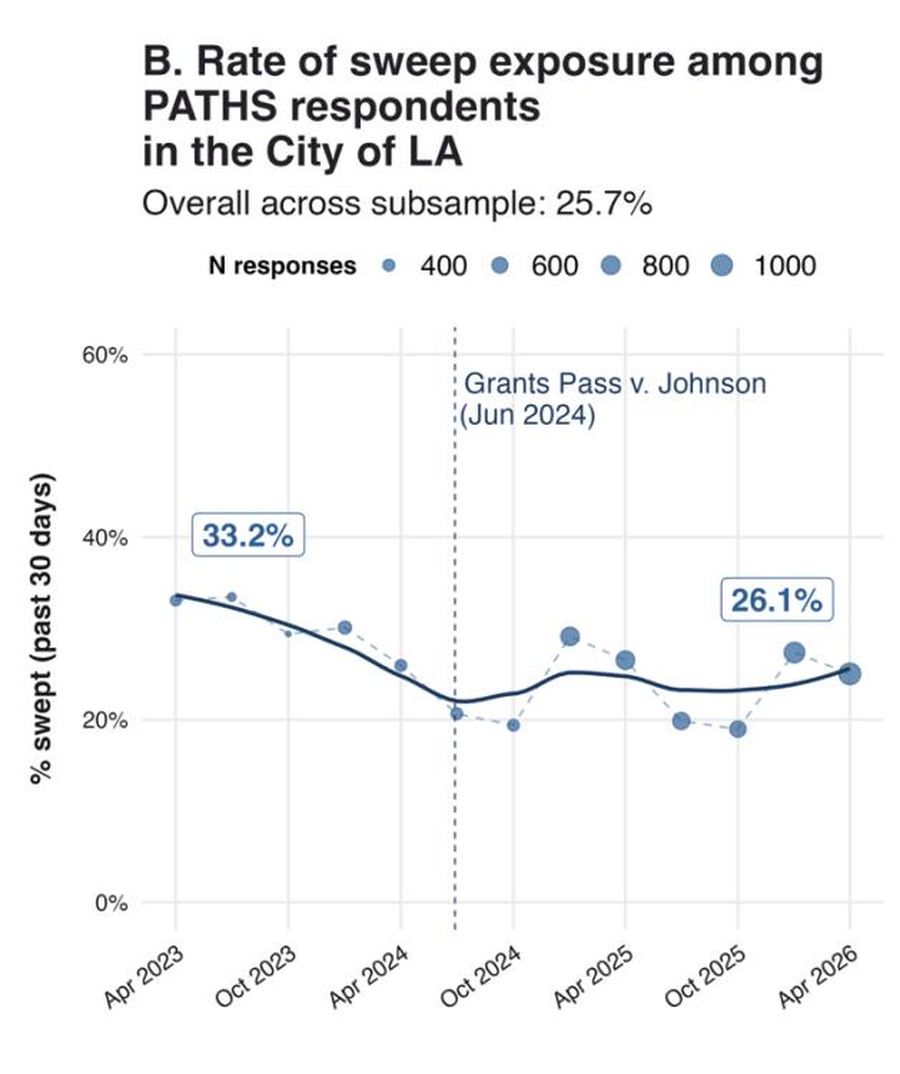
While there is a perception that sweeps may have risen sharply since the Grants Pass ruling, this pattern does not appear in the data. At face value, exposure to sweeps declined, from 32% reporting a sweep in a given month in the first six months of the panel down to an average of 23% across 2025, before rising modestly to about 25% in the first half of 2026. This held even when the sample was restricted to respondents in the City of LA.
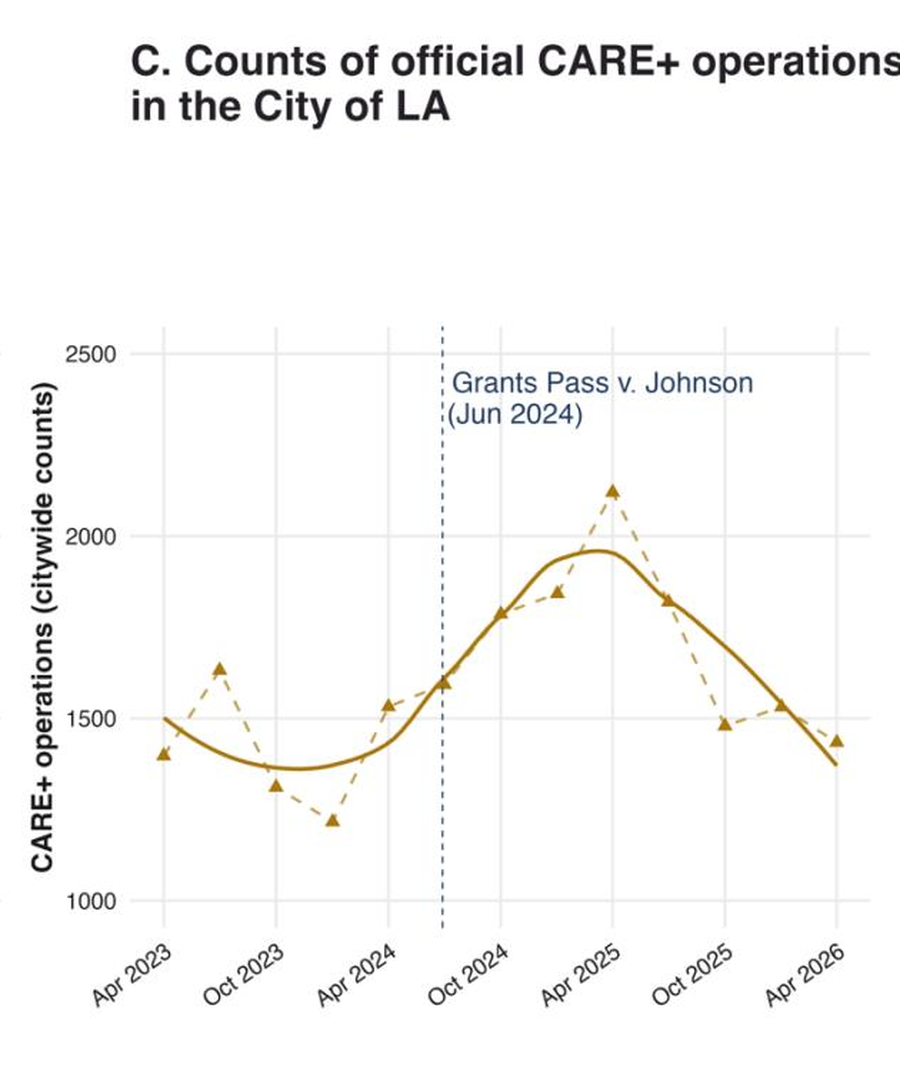
The decline is surprising given reports of a rising number of sweep operations, including a 30% increase in CARE+ operations in the City of LA. However, the scattering of encampments and the rise of rough sleeping mean each sweep likely targets fewer people than before, and many sweeps are repeat operations concentrated at previously cleared sites. What can be said with certainty is that sweeps remain a routine feature of life for unsheltered Angelenos.
Offers are rare, and getting rarer
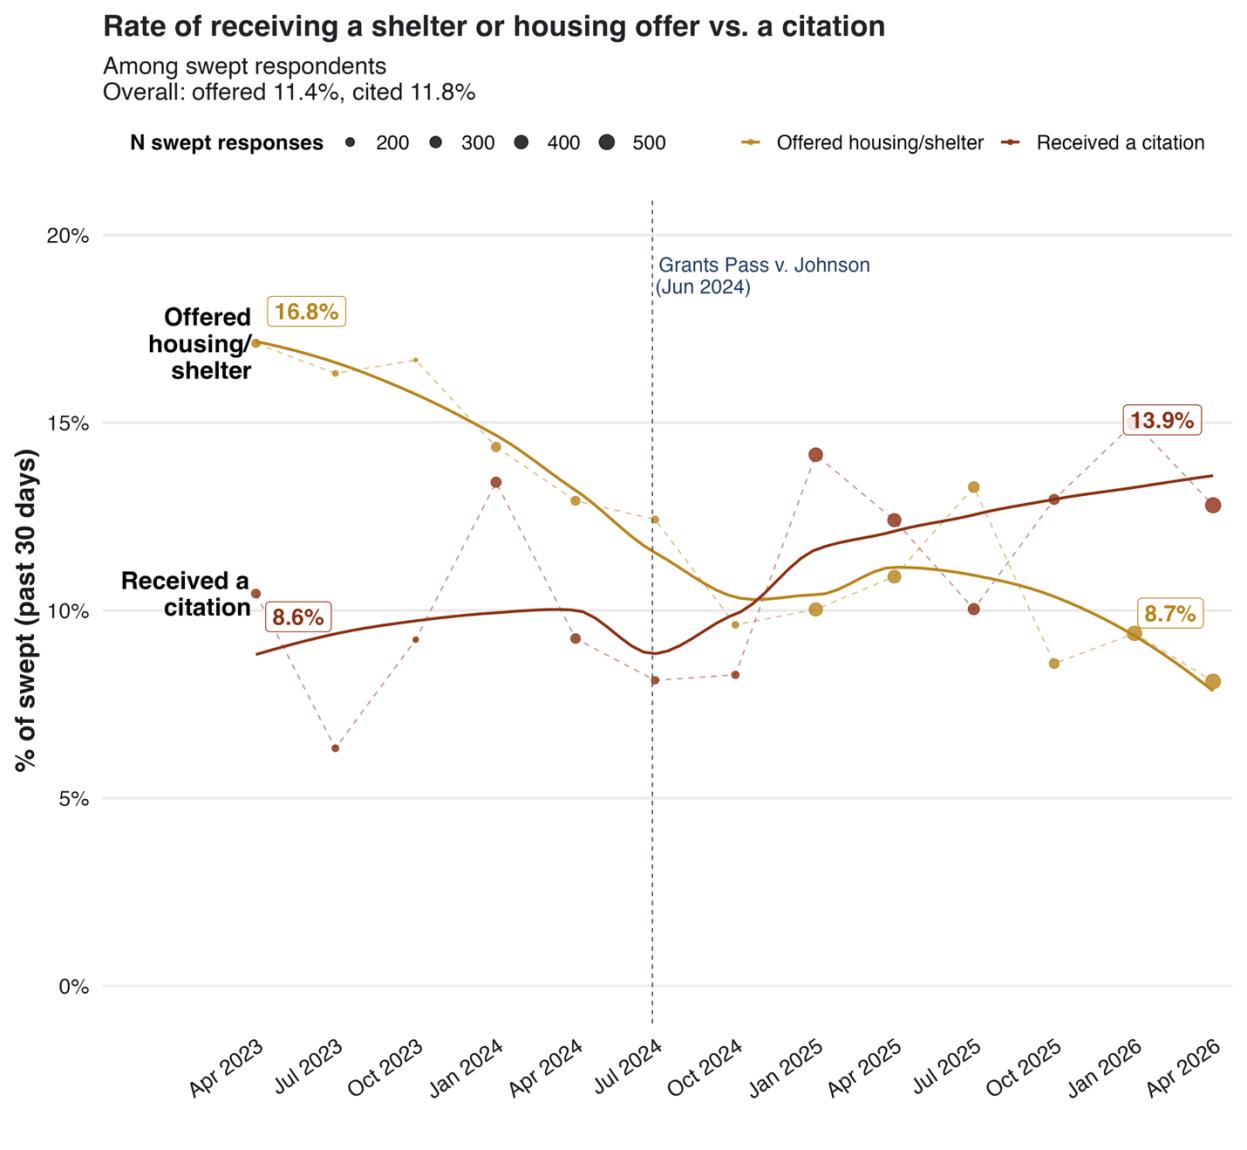
Sweeps in Los Angeles rarely include an offer of interim housing or shelter, and such offers are becoming rarer. Just one in nine sweeps, about 11%, was associated with a shelter or housing offer, an even lower rate than the 13% reported in 2023.
The very nature of sweeps appears to have changed over time. The rate at which sweeps involved a shelter or housing offer fell by half, from about 17% in 2023 to about 9% in 2026. Over the same period the share of sweeps leading to a citation rose from about 9% to about 14%. Whereas the 2023 report noted that a sweep was more likely to lead to a citation than a shelter move, in 2026 a sweep is far more likely to lead to a citation than a shelter offer. In short, the enforcement component of sweeps has grown while the housing component has declined.
Citations carry repercussions beyond the fine itself: unpaid or unresolved citations can trigger a bench warrant for arrest and a cascade of downstream negative effects, including on housing access and employment.
These trends also mirror changes in the composition of sweep teams. Respondents most commonly reported being notified by police or law enforcement, about 63% of sweeps, followed by sanitation workers at about 38% and homeless outreach workers at about 17%. From 2023 to 2026 the share notified by outreach workers declined from 18% to 15%, while the share involving police rose from 64% to 68%.
When offers are made, most people accept
While popular media and public sentiment often portray unhoused people as resistant to shelter, around two thirds of respondents who received an offer, 227 of 350, accepted it. Acceptance was highest for settings that met basic expectations of privacy and stability.
Across every option, the rates at which people actually accepted offers were considerably higher than the hypothetical interest they had expressed at enrollment. Among those offered a motel or hotel like setting, 78% accepted, compared with 53% who had indicated a general interest in such a stay. More strikingly, while just 10% of respondents had expressed general interest in congregate shelter, nearly half, 46%, accepted it when offered. Supportive housing offers were accepted at the same rate as motel and hotel offers.
Declining an offer, in other words, usually reflects a mismatch between what was offered and what people need, such as privacy and safety. On the whole, respondents are considerably more willing to accept whatever option is offered.
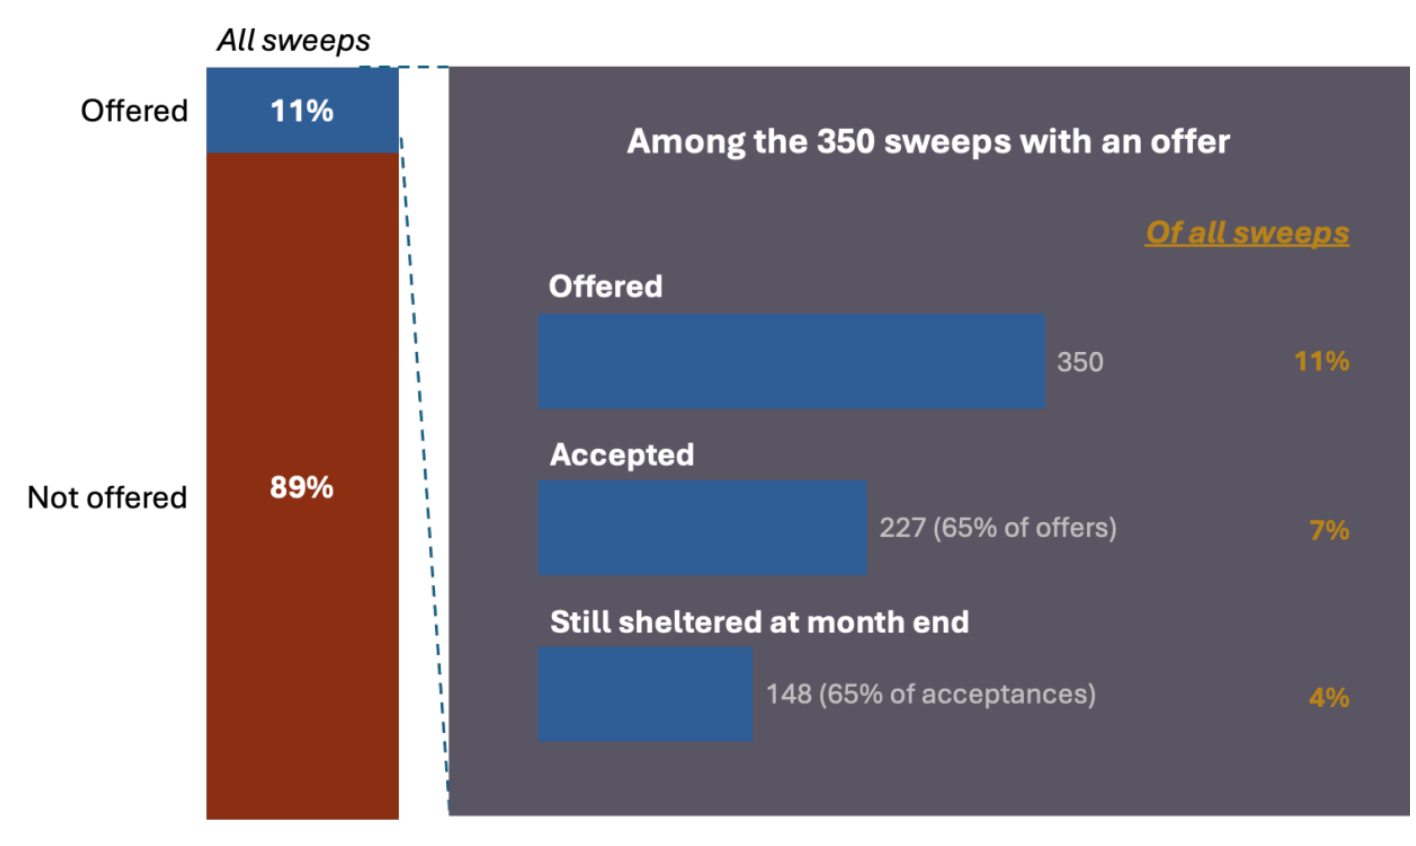
Table 4. Acceptance rates of shelter and housing offers made during sweeps
| Offer type | Share accepted | Number offered |
|---|---|---|
| Any shelter or housing offer | 65% | 227 of 350* |
| Temporary stay in a motel/hotel-like setting | 78% | 100 of 128 |
| Bridge housing or transitional housing program | 80% | 49 of 61 |
| Supportive housing | 78% | 28 of 36 |
| Private room in shelter | 68% | 30 of 44 |
| A tiny home | 55% | 17 of 31 |
| Congregate (group) shelter | 46% | 36 of 79 |
*Thirty-seven respondents who reported being offered shelter or housing during a sweep selected “prefer not to answer” when subsequently asked whether they accepted the offer, and are therefore excluded from the acceptance-rate denominator.
Among those who accepted an offer, approximately two thirds, 148 of 227, remained in shelter the same month, suggesting that offers made during sweeps can result in short term shelter stays. But set against the entire sweep to placement pipeline, the largest limitation is that most people who are swept never receive an offer in the first place. When shelter stays are calculated across all sweeps, not just those in which an offer was made, just 4% resulted in a meaningful shelter stay.
Taken together, high acceptance and retention among those offered shelter, alongside low placement across all sweeps, indicate that the primary constraint lies in the supply of offers instead of people's willingness to accept them.
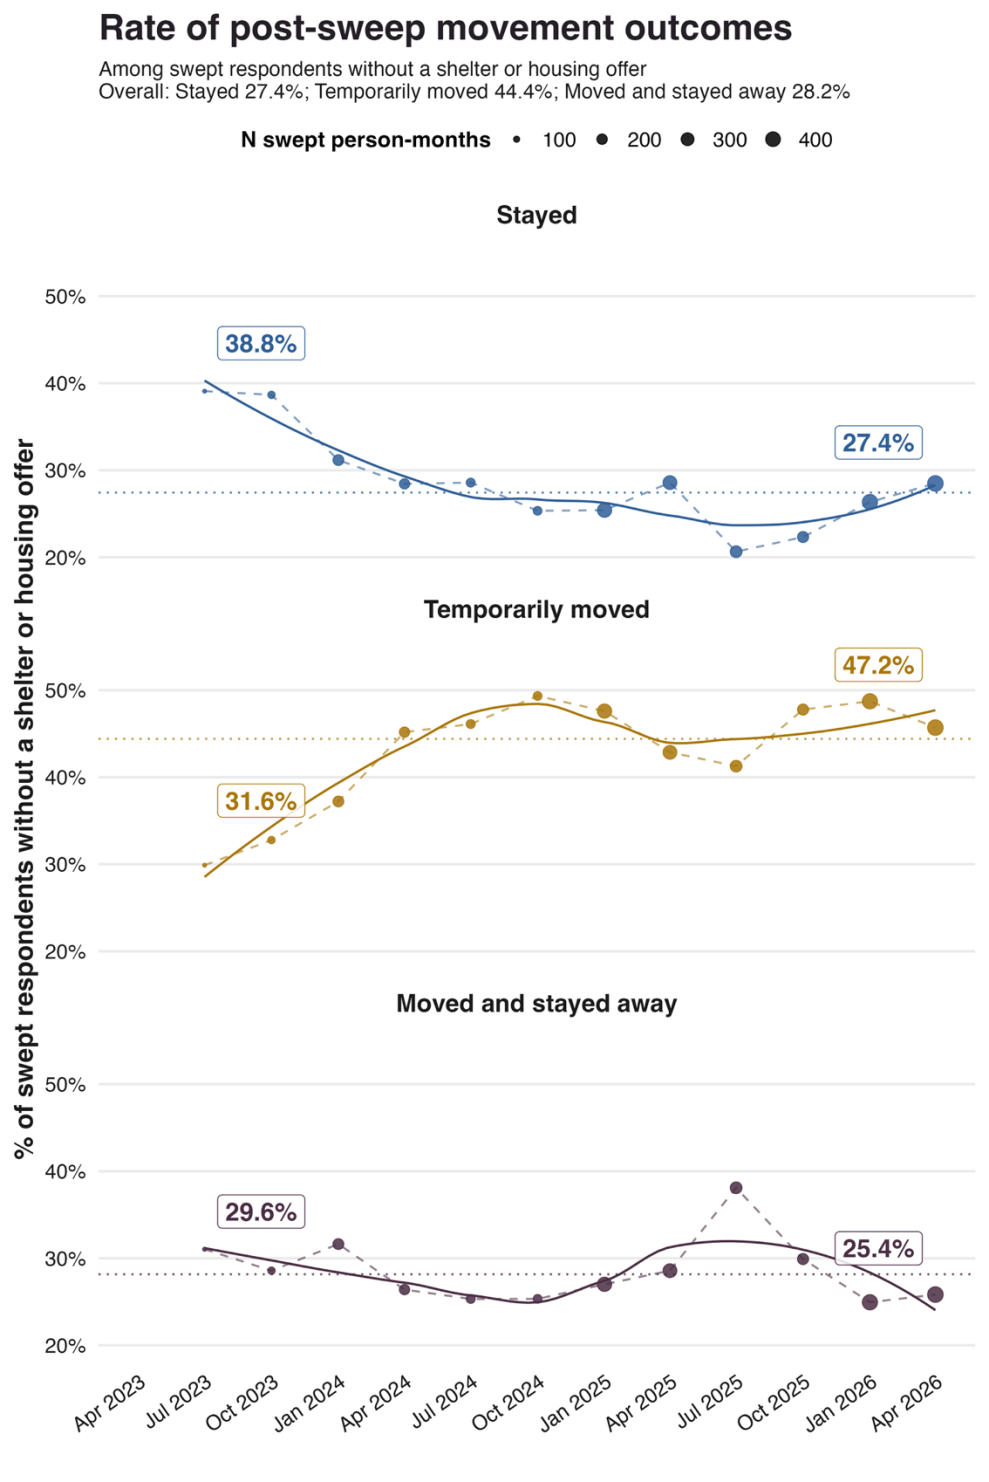
Among those who received no shelter or housing offer, the vast majority of people swept, there is a clear shift in how sweeps resolve. The share who stayed put at the swept location has fallen from 39% to 27%, while the share who temporarily left and later returned has risen from 32% to 47%. Only one in four people move and stay away, which is arguably the outcome a sweep is intended to achieve. Compliance with sweeps, in the sense of moving when told, has increased without translating into shelter or housing.
What a sweep costs the people who stay outside
Because so few sweeps lead to shelter or housing, the impact of a sweep is felt almost entirely by people who remain on the street afterward.
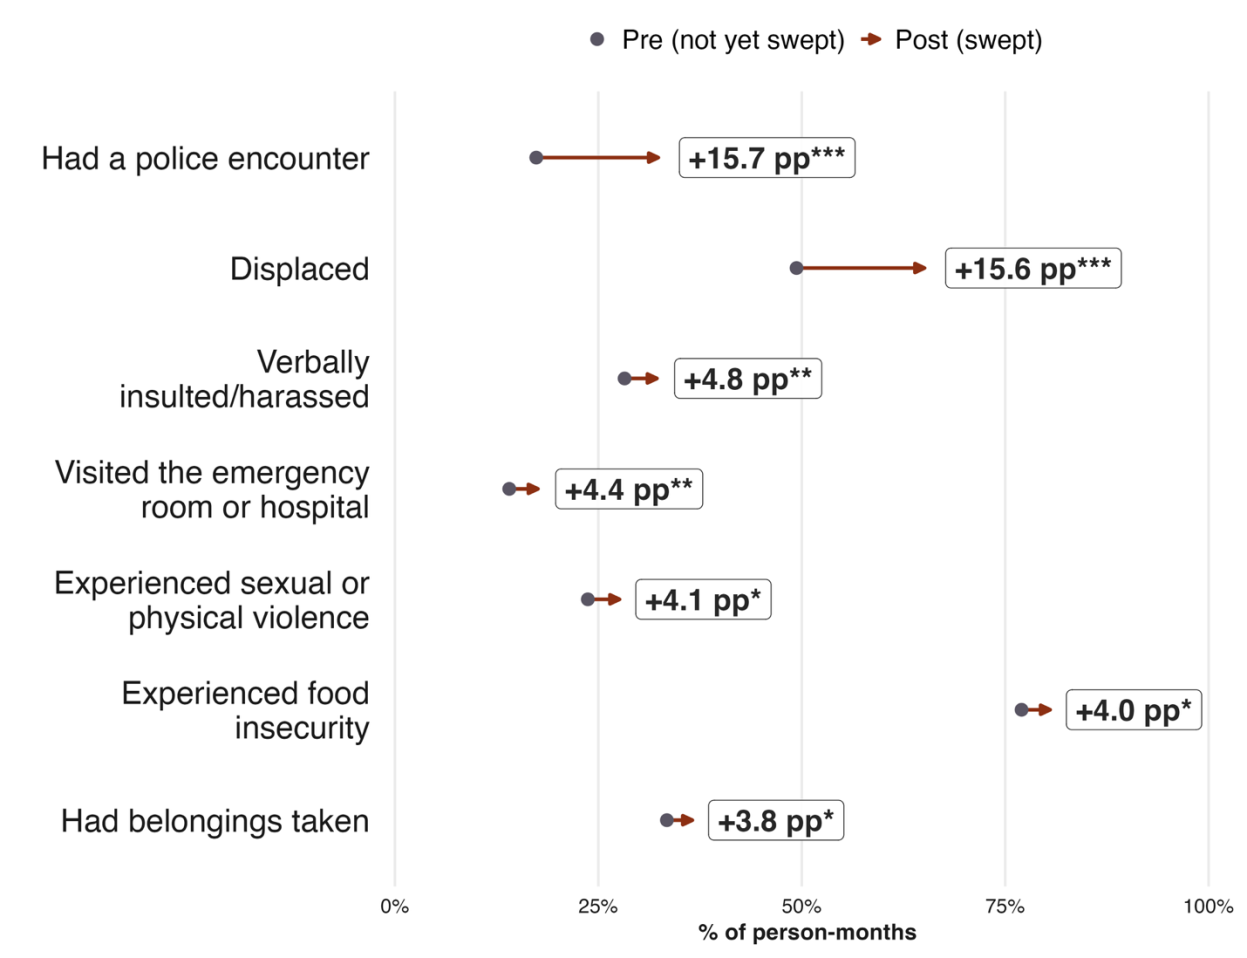
Within the same person's timeline, several consequences were substantially and consistently more common in the month of a sweep than in that person's previous month without one. The largest and most consistent differences were in police contact and forced displacement, both approximately 16 percentage points higher, which correspond to the mechanics of the operation itself: a police involved event that requires someone to move. Also notable were increases in property loss, food insecurity, emergency department visits, verbal harassment, and sexual or physical violence.
These increases are measured against baselines that are already extraordinarily high. Even in months without a sweep, roughly three in four respondents experienced food insecurity, about half were displaced, one in three lost their belongings, and nearly one in four experienced physical or sexual violence. With baseline levels this high, even an increase of a few percentage points represents a substantial added burden on people already living under extreme hardship.
Part 2: Encampment Resolution Programs
ERPs are pitched as a solution to unsheltered homelessness as a whole, but in practice they specifically target large encampments, typically defined as those with five or more dwellings. The high intensity of outreach and the limited availability of hotel rooms have limited the total number of operations to 136 in the City of LA's Inside Safe program and 77 in LA County's Pathway Home since they launched in December 2022 and August 2023 respectively.
Inside Safe invitations reached approximately 6% of the cohort, 83 of 1,361, while Pathway Home reached 13%, 179 of 1,361. Another 12%, 168 respondents, indicated they were unsure which program they were invited to, which points to real difficulty in identifying which agency is reaching out to them.
Invitation and sweep exposure also overlap substantially at the person level: among everyone ever invited to an ERP, 305 people, 76% had also been swept at some point, and 53% experienced a sweep in the very same survey month as an invitation.
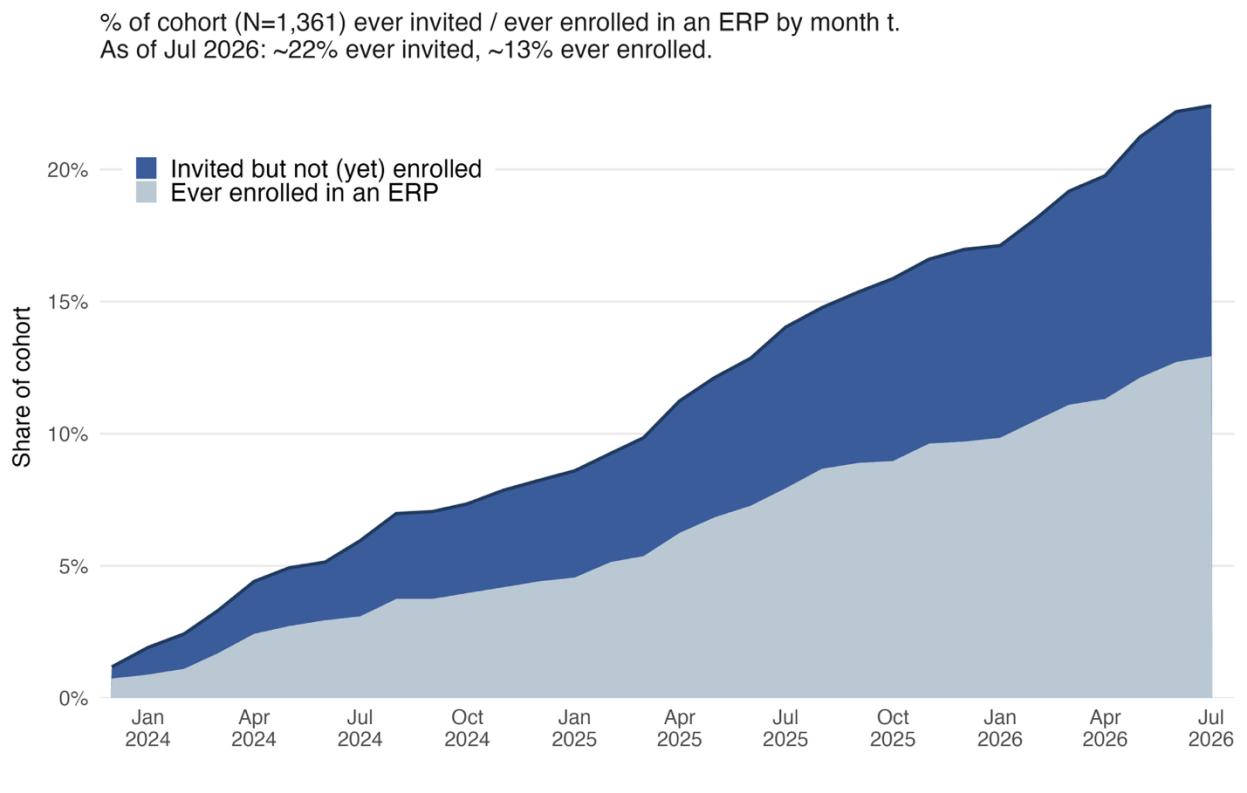
Table 5. Comparing the housing pathways of ERP invitations and homeless sweeps
Person-level comparison among the full tracked cohort (N=1,361), following each respondent for six months after their first ERP invitation or first sweep.
| Stage | ERP-invited | Swept-only |
|---|---|---|
| 1. Experienced | 305 (22% of cohort) | 744 (55% of cohort) |
| 2. Enrolled/accepted a shelter or housing offer | 152 (50%) | 30 (4%) |
| 3. Sheltered or housed within 2 months | 79 (26%) | 21 (3%) |
| 4. Sheltered or housed most of a month | 61 (20%) | 16 (2%) |
| 5. Remained sheltered or housed at last follow-up | 50 (16%; 4% of cohort) | 10 (1.3%; <1% of cohort) |
Using each respondent’s first observed event in the panel, capping follow-up at six months after that event. Percentages represent the share progressing from the previous stage unless otherwise noted. The swept-only group includes respondents who were swept but not invited to an ERP at any point during the six-month window.
Of the 79 people who moved indoors, 50, or 63%, remained in shelter at the end of follow up. That is broadly comparable to the 60% figures reported by the Los Angeles Times, the LA City Controller audit, and other sources.
Taken together, just 50 of the 305 ERP invitees, or 16%, remained housed at the end of follow up. This compares favourably with 1.3% of people who were ever swept, 10 of 744. Even though ERPs reached far fewer people in the PATHS sample than sweeps did, they resulted in five times as many enduring shelter placements. Even so, those 50 individuals still only constituted 3.6% of the full PATHS sample. ERPs deliver roughly twelve times the shelter yield of sweeps on a per person reached basis, yet still result in an enduring placement for fewer than 1 in 25 respondents overall.
Furthermore, the stated end goal of an ERP is permanent housing, not interim housing. Just 23 enrollees progressed to permanent housing within the first six months of invitation. As a share of the 50 who ever remained sheltered or housed, that 46% conversion rate sounds promising. But across the entire group of 305 ERP exposed individuals, the housing rate is 7.5%. Taken as a share of the entire sample of 1,361 individuals, just 1.7% of people were placed in permanent housing as a result of ERPs.
Proponents present ERPs as a housing focused intervention that does not carry the same consequences as sweeps. Comparing each approach against months with neither intervention, ERP invitations were associated with a 10 percentage point increase in the share of respondents who got help applying for services, from 51% to 61%, while sweeps produced statistically significant increases in displacement, property theft, police contact, and citations.
A separate version of this comparison restricted to people who go on to enroll in an ERP, rather than merely receive an invitation, found two further statistically significant improvements: a 9 percentage point decrease in poor self rated physical health and an 11 percentage point decrease in feeling unsafe where they sleep, relative to their own non enrolled months.
Table 6. Comparing the effects of ERPs and homeless sweeps
| Outcome | Sweep vs. neither | ERP invitation vs. neither | Difference (invitation − sweep) |
|---|---|---|---|
| Had a police encounter | +15 pp*** | +6 pp | −9 pp* |
| Cited for staying on the street | +5 pp*** | +2 pp | −3 pp |
| Displaced | +17 pp*** | +3 pp | −13 pp** |
| Had property/belongings taken | +6 pp** | −7 pp | −12 pp** |
| Visited the emergency room or hospital | +4 pp** | +5 pp | +2 pp |
| Got help applying for services | +1 pp | +10 pp* | +9 pp* |
pp = percentage points. * p<.05, p<.01, * p<.001. Estimates show changes in outcomes associated with sweep exposure and ERP invitation relative to no intervention. Models include person and year-month fixed effects with cluster-robust standard errors.
What the findings mean
If the goal was to design an encampment operation that fares better than a conventional sweep, ERPs appear to accomplish it. They are more likely to bring people indoors, more likely to connect them with services, and less likely to expose them to enforcement, displacement, and property loss.
But ERPs are costly and resource intensive operations that reach a relatively small share of the unsheltered population, and their apparent success depends heavily on which outcomes are measured and which people remain in the denominator. A retention rate of approximately 60% among those who enter interim housing may appear encouraging, but it excludes people who were never invited, those who did not enroll, those who enrolled but never received a placement, and those who returned outside. These groups constitute most of the people encountered through the intervention.
An operation may successfully clear a location while leaving most of the people who lived there homeless and increasingly scattered, from the relative safety of large encampments in accessible locations into rough sleeping or smaller encampments in isolated places where they become even harder to reach. If the objective is resolving homelessness rather than resolving the visible presence of an encampment, the current results remain inadequate.
Current definitions of encampment resolution can further obscure this distinction by treating site clearance as an outcome alongside placement into durable housing. An operation may be classified as resolved even when only 26% of those invited enter interim housing and 7.5% reach permanent housing within six months. Site clearance, interim placement, continued residence indoors, and entry into permanent housing are different outcomes and should be reported as such.
Implications for Los Angeles
With approximately 21 months remaining before the Games, improving ERPs will be important, but it will not be enough. The findings point to three priorities.
1. Expand access to permanent housing within the remaining time. Los Angeles cannot build all the affordable housing it needs before the Games, but it can examine whether additional housing can be secured through rental subsidies, flexible financial assistance, master leasing, property acquisition or conversion, and stronger incentives for landlords accepting tenants with vouchers. Without more housing at the end of the pathway, interim placements will remain bottlenecks instead of bridges to permanent homes.
2. Strengthen the pathway from outreach to permanent housing. ERPs need multiple placement options, interim settings that preserve greater autonomy, and continued engagement when an initial offer does not result in placement. People may experience repeated sweeps, but ERP invitations are much less likely to recur: Los Angeles currently appears better equipped to return and move someone again than to return with a different offer of assistance. People with lived experience should be paid a living wage, provided sufficient hours to build careers from their expertise, and given meaningful roles in program design, implementation, evaluation, and governance.
3. Develop safe options for people who cannot be placed indoors. Most people living outside are never reached by ERPs or do not get placed in interim housing. If they cannot remain where they are and no appropriate indoor option exists, they still need somewhere safe and lawful to go. Repeatedly directing people to another sidewalk merely transfers the problem and exposes them to another cycle of displacement. Los Angeles should consider a broader range of alternatives, including safe parking and sanctioned camping programs that provide sanitation, water, storage, health care, outreach, transportation, and continuing pathways toward housing. Such programs are not substitutes for permanent housing, but the absence of any viable alternative leaves repeated displacement as the default.